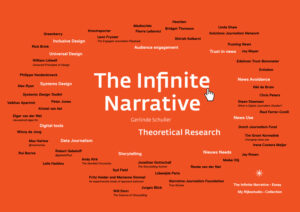
The Infinite Narrative – A systematic approach to complex stories
by Gerlinde Schuller
How can a complex story be effectively communicated? This is the opening question of the research project which examines to what extent a synthesis of systems design and storytelling can facilitate and enrich the communication of complicated, multi-layered contents. To this end, the project will further develop and lay down my information design method Systematic Storytelling.
The challenge is to do justice to a high degree of complexity: a main theme with numerous secondary themes that are convoluted and interwoven, a variety of narrative formats, broad geographic coverage, long-term documentation, a nonlinear mode of reading, a broad range of international users, and a short response times.
The aim of the project is to develop new, nonlinear and network-like narrative structures and the attendant tools that support these structures in technological terms.
Further research questions: –How can classification systems help to convey complex stories? –How can the user be offered individual access to these stories? –What can a nonlinear narrative structure look like for long-term documentation? –How can different narrative forms be combined? –How can the user easily switch between overviews and individual narrative forms? –How can different narrative techniques be combined and how can they be encoded visually? –To what extent can different narrative techniques be selected flexibly? –What are the requirements for a web template that is suitable for customizing?
“The current narrative and display formats of media platforms are not geared to a high degree of complexity. More efficient presentation formats are required for adequate reporting on complex stories.”
Gerlinde Schuller
The project is funded by Creative Industries Fund NL and Stichting GO Fonds.
The Infinite Narrative – Essay I describe the project in my essay The Infinite Narrative – Systematic Storytelling for Complex Information. It is published on Nightingale, the Journal of the Data Visualization Society (US). Read the English article Read the German version of the article
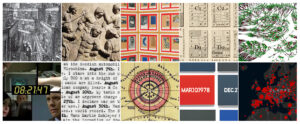
The Infinite Narrative – Analysis of inspiration sources at the intersection of system design and storytelling I analysed 10 works from different disciplines, such as literature, art, information design, film, urban planning and data visualisation. Their concepts are based on a combination of system design and storytelling. I disassembled them into their conceptual components to find out how their systematic and storytelling-ingredients complement and enrich each other. Link to analysis
The Infinite Narrative – Theoretical Research I have summarized the theoretical research on the project in an interactive theme cloud.
_ _
Inspiration sources at the intersection of systems design and storytelling
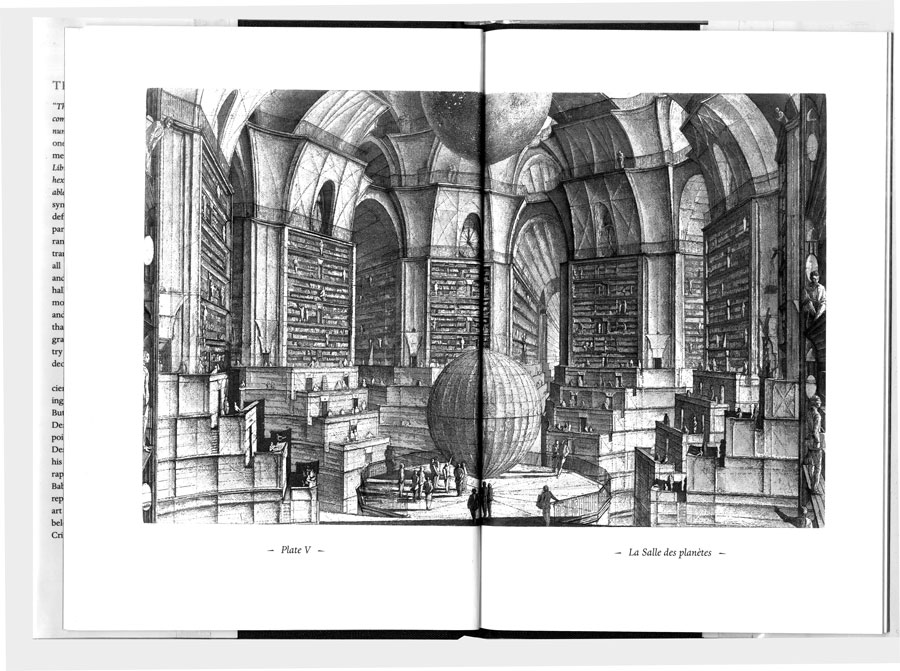
The Library of Babel (1941) Jorge Luis Borges
In his short story, Jorge Luis Borges describes the universe as an infinite library that contains every book that has ever been written or is still being written.
Image: Engraving by Erik Desmazières in The Library of Babel Source
Trajan’s Column (AD 112/113) Rome, Italy
The victory column was constructed for the Roman emperor Trajan and depicts scenes from successful wars in a spiral. In addition to 2500 human figures, the emperor himself can be seen up to 60 times on 23 windings with a total length of 200 meters.
Image: Wikimedia Commons
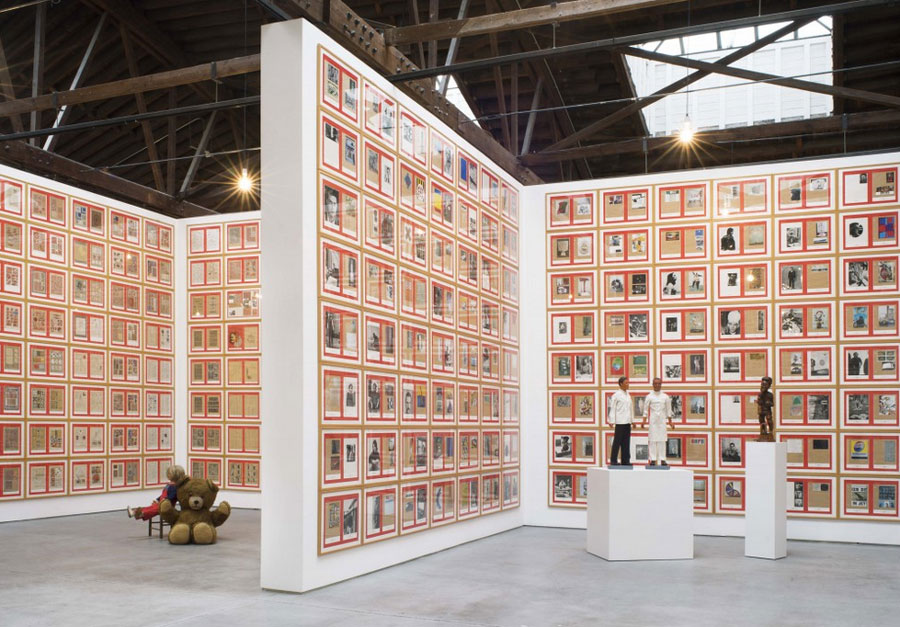
Cultural History 1880-1983 (2003) Hanne Darboven
The encyclopedic installation combines cultural, social and historical references with autobiographical documents by Hanne Darboven. The work consists exclusively of visual material (1,590 works on paper and 19 objects) which, grouped and arranged in chronological order, refers to historical methods of archiving.
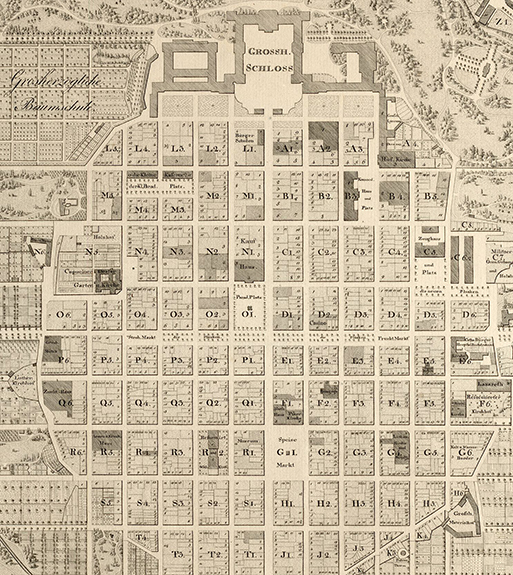
The city center of Mannheim, also known as ‘City of Squares’, is designed as a planned city. The beginnings date back to 1606. Even today, the city center consists of 144 ’squares’ which are actually different rectangles. There are rectangular, rhombic and trapezoidal ‘squares’ and two triangles. An address is formed by the square code with the associated house number, for example: D 6, 2.
Image: Generallandesarchiv Karlsruhe (DE)
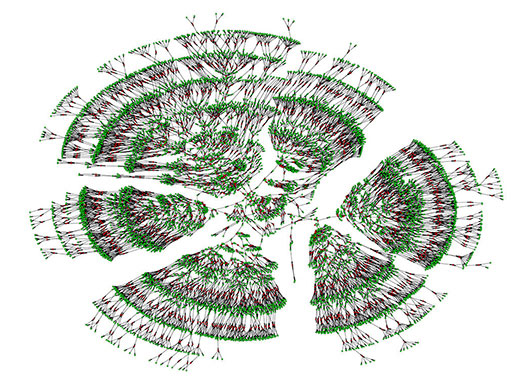
Family Tree (2018) Joanna Kaplanis, Yaniv Erlich, New York Genome Center (US)
On the world’s largest family tree 13 million people, mainly from Europe and North America, are connected in a time frame of 500 years. For this purpose, 86 million profiles of people from a genealogy website were processed. Their birth, marriage and death dates and -places were used to visualize the family tree.
’24’ TV series (2001) Joel Surnow, Robert Cochran for Fox (US)
The series is characterized by the action taking place in real time. The commercial breaks imply that the plot continues unnoticed. Other style features are split screens and a countdown structure that illustrates the race against time using a digital clock.
Image: Fox Corporation (US)
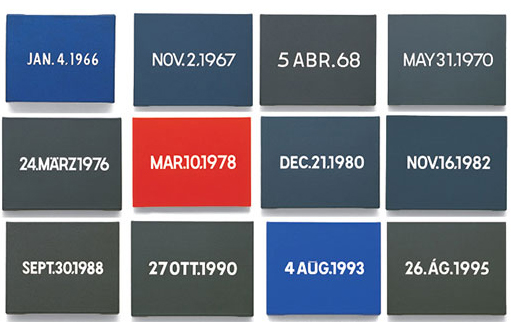
Today Series (1966-2014) On Kawara
The series includes nearly 3,000 paintings that show the date of the day On Kawara painted the picture. The date format corresponds to that of the country in which he stayed at the time. As far as the national language did not use Latin characters, the date is shown in Esperanto. The respective image has one of eight specified landscape formats. On Kawara marked each finished picture in a Hundred-Year Calendar, in which, beginning with his date of birth, he systematically marked every day of his life with a yellow dot and every finished painting with a green dot.
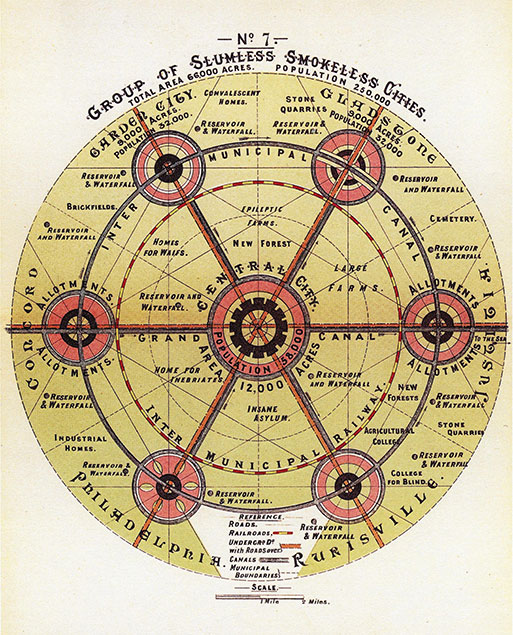
In this publication, the British city planner Ebenezer Howard describes his idea of reorganizing society by means of networks of garden cities. He believed that bringing urban and rural life together could break the strong influence of capitalism and lead to cooperative socialism.
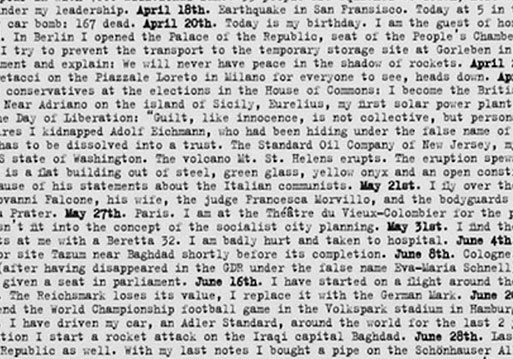
Installation in the form of a calendar (366 days from different years) in which Daniela Comani, as the first-person narrator, reports about events from the entire 20th century. She narrates as if this had happened to her, impersonating Hirohito, Hitler or Einstein. The wall installation exists in eight languages.
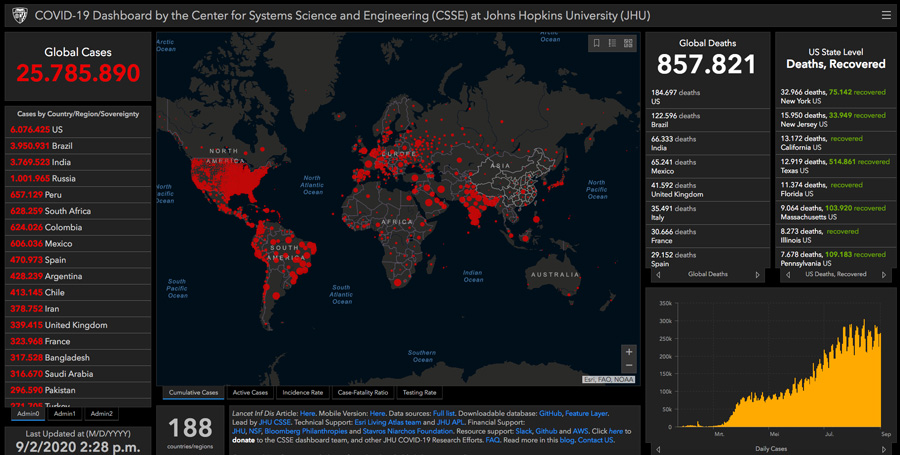
COVID-19 Dashboard (2020) Ensheng Dong, Hongru Du, Lauren Gardner, Center for Systems Science and Engineering (CSSE) at Johns Hopkins University, Baltimore (US)
Researchers from Johns Hopkins University developed one of the first and most widely used online dashboards to visualize and track reported cases of coronavirus disease in real time. The dashboard, first shared publicly on January 22, 2020, illustrates the location and number of confirmed COVID-19 cases, deaths, and recoveries for all affected countries.